wallagg - bitcoin wallets aggregator
**correlation ≠ causation
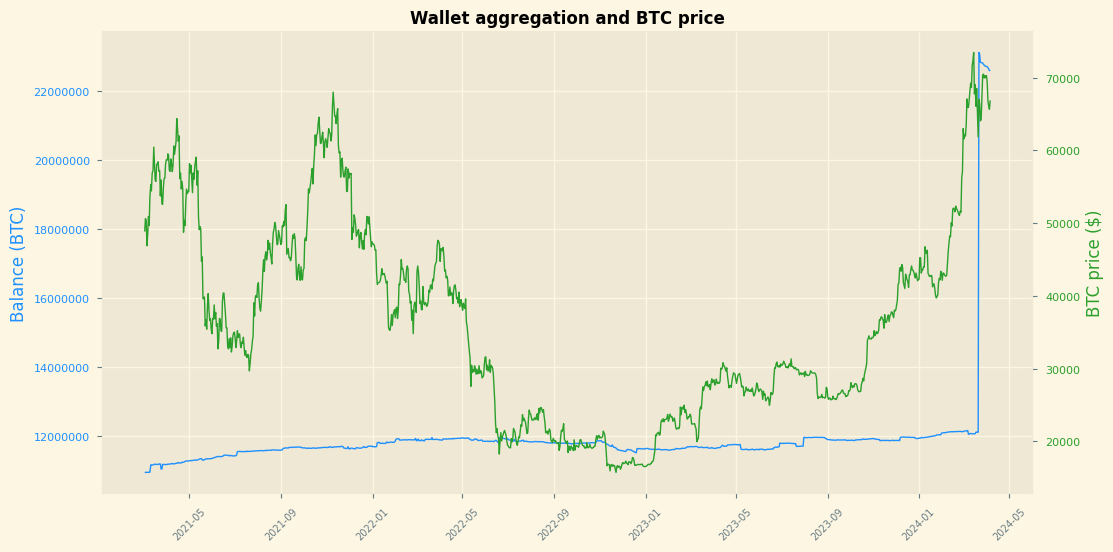
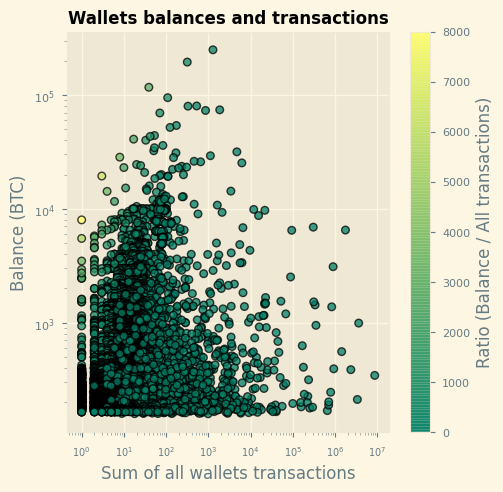
This website collects the top 10000 richest Bitcoin wallets data on the daily basis from bitinfocharts.com. Data that could potentially present interest is:
- balances of the wallets
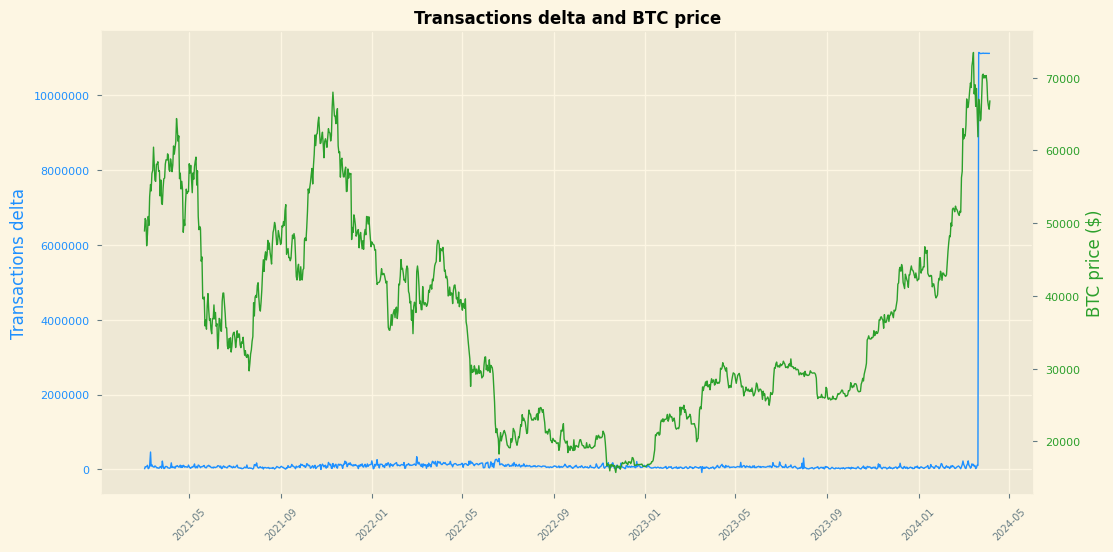
- transaction numbers of in/out of the wallets
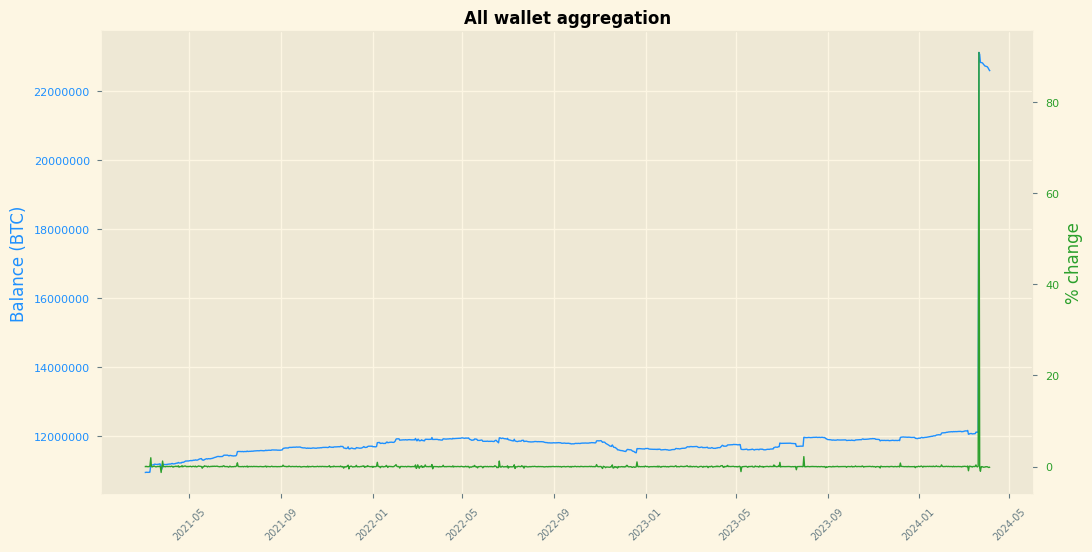
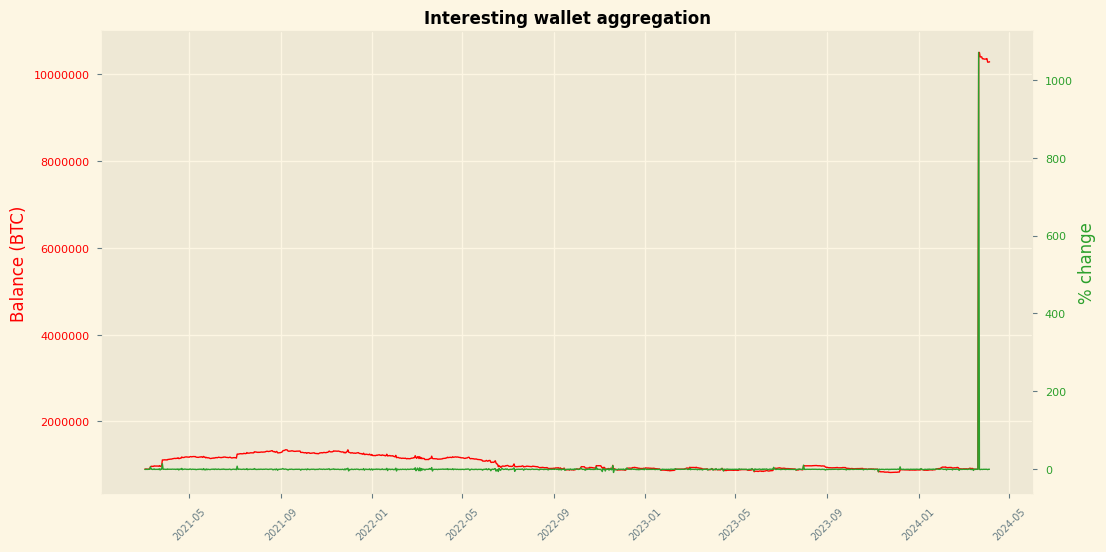
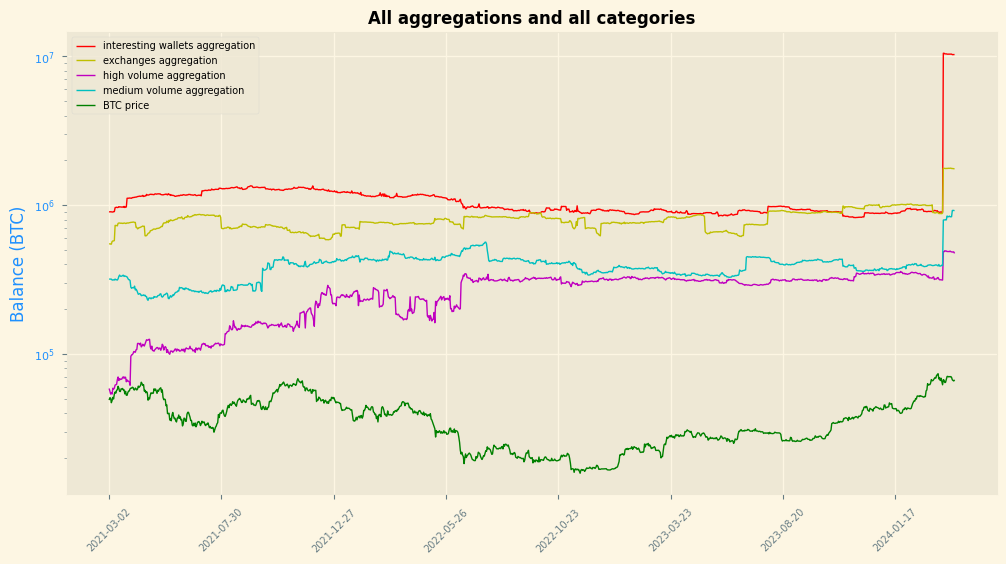
Wallet balances are aggregated and day-to-day changes are visualised on the plots. Transactions delta is calculated by subtracting "out" transactions from "in" transactions for each wallet and then all deltas are summarised and also displayed on the plots.
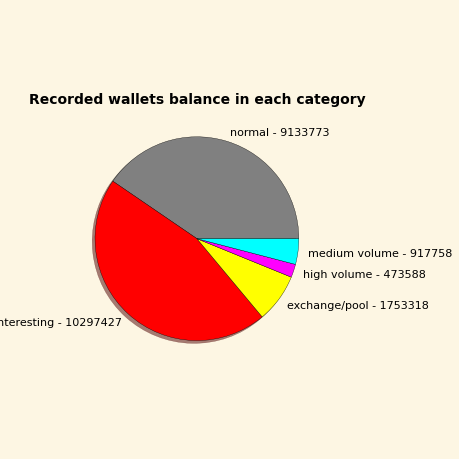
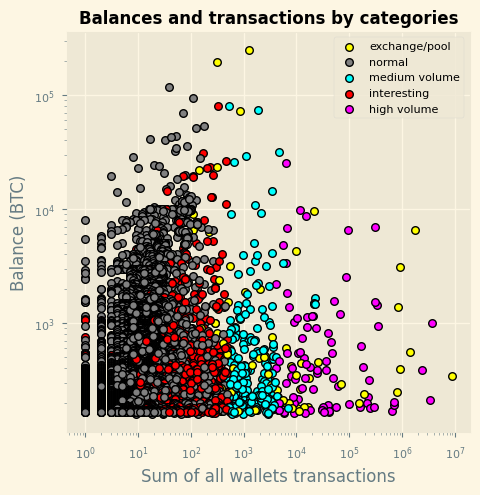
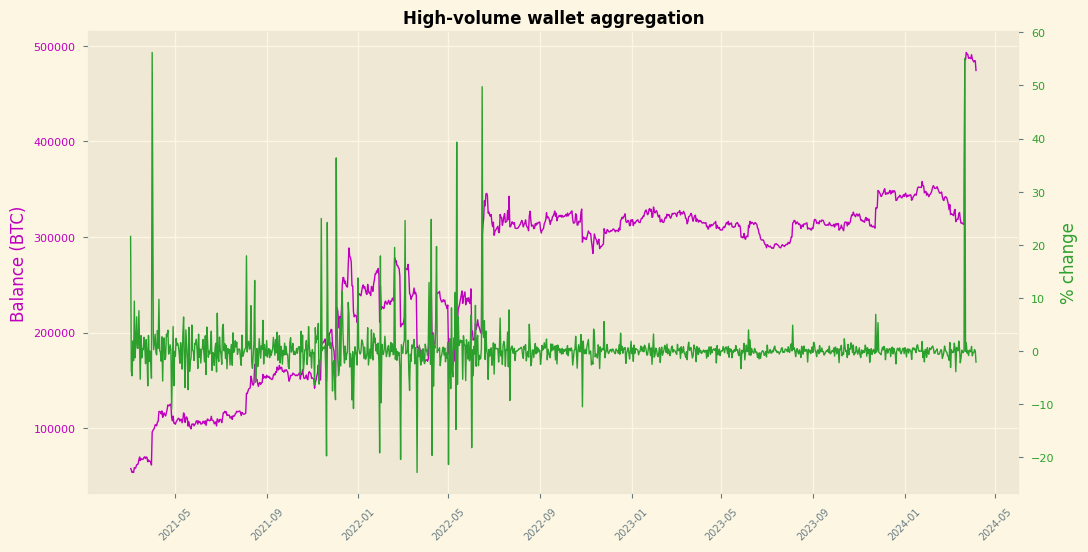
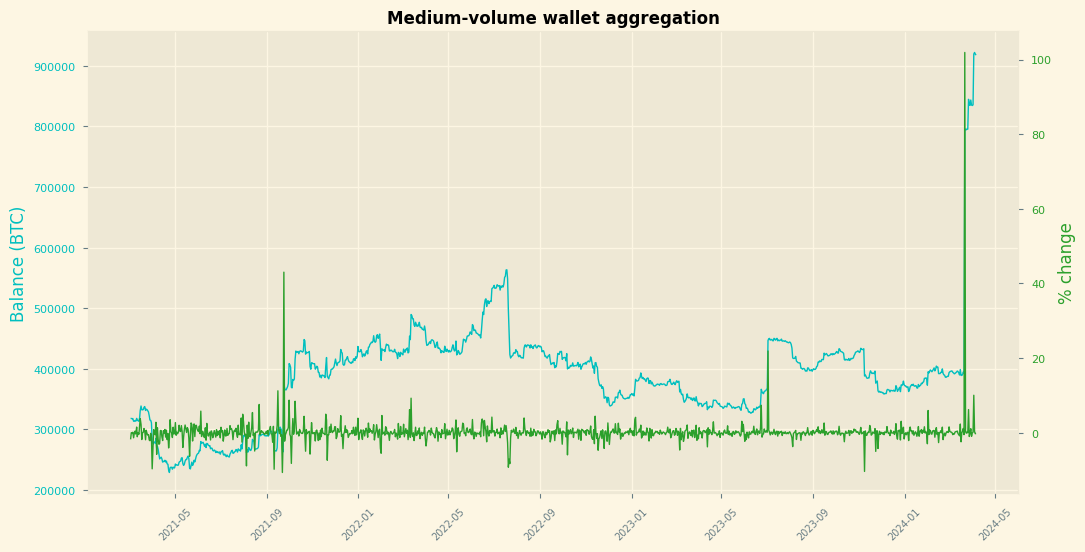
Wallets can be broken into categories based on their "performance". Bitinfocharts already identified some of the major exchanges and pools wallets such as Binance, Bitfinex and many others. Bitinfocharts also marked some of the wallets for reasons only they know, so those wallets are assigned to the "interesting" category. Wallets that have a total transactions number > 500 are assigned to the "medium volume" category. Wallets that have > 2000 ins and > 2000 outs transactions are allocated to the "high volume" category. And the rest of the wallets are placed to the "normal" category.
Here is a quick categories breakdown:
Binance, Poloniex, Kraken, SlushPool, etc |
exchange/pool |
Marked by bitinfocharts |
interesting |
Total transactions number > 500 |
volume:medium |
> 2000 ins and > 2000 outs transactions |
volume:high |
Wallets that don't fit in any of the categories above |
normal |
*wallet can be assigned to only one category
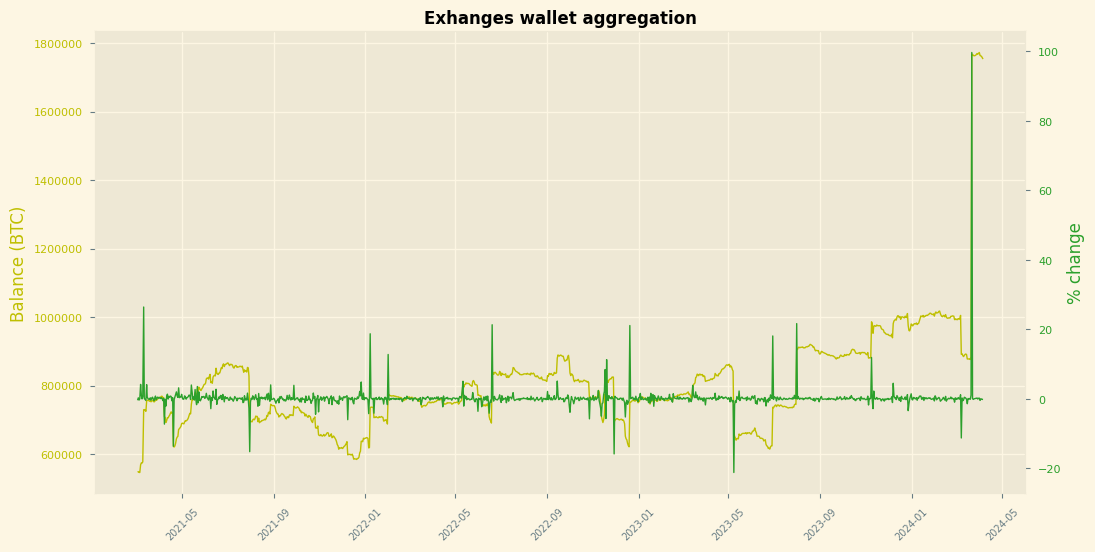
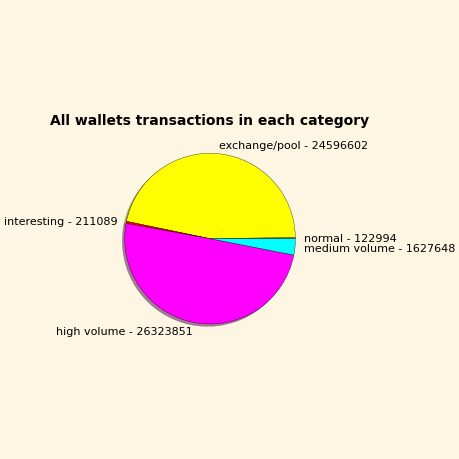
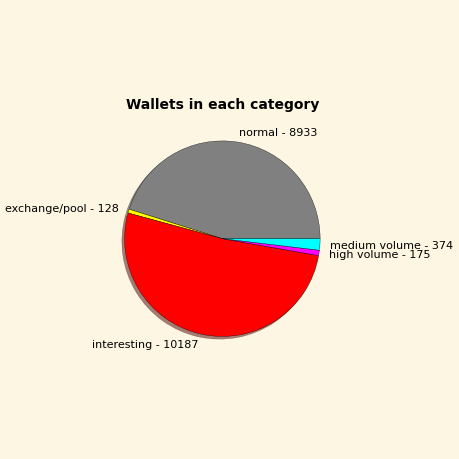
Here is a bunch of informative pie-charts. We can clearly see that high-volume and exchanges/pool categories despite being the smallest categories are responsible for the main bulk of all the transactions.